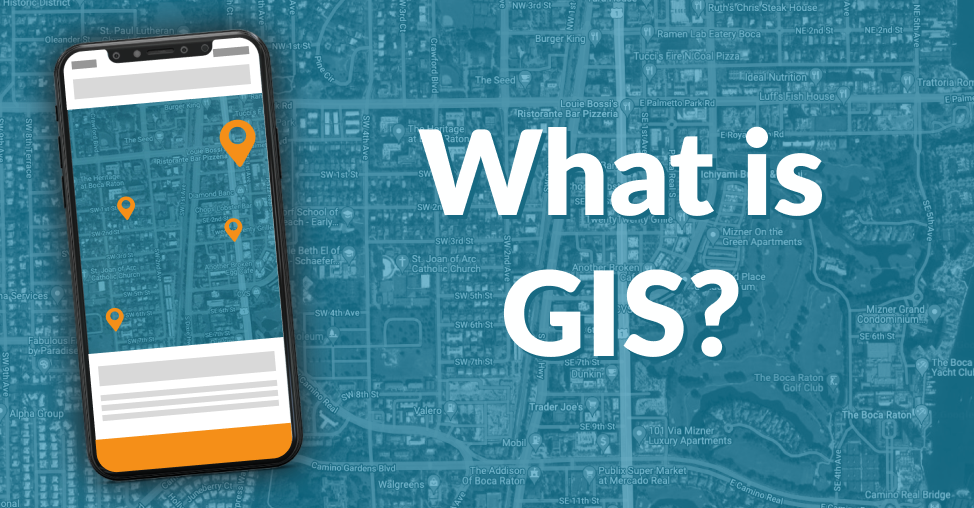
What is a geographic information (GIS) system?
A geographic information system (GIS) is a system for creating, managing, analyzing, and mapping various types of data. GIS ties data to a map by combining location data (where things are) with several forms of descriptive data (what things are like there). This lays the groundwork for mapping and analysis employed in science and nearly every sector. Users can utilize GIS to better comprehend trends, relationships, and the context of their location. Improved communication and efficiency, as well as better management and decision-making, are all advantages.
See an overview at https://www.esri.com/en-us/what-is-gis/overview
What is ESRI?
ESRI (Environmental Systems Research Institute) is a company that was founded in 1969 in Redlands California as a land-use consulting firm. They are a global provider of geographic information system (GIS) software, web GIS, and geodatabase management software. "The Science of Where" is their company tagline, and that really says it all.
ESRI refers to its suite of GIS software products as ArcGIS which run on desktop, server, and mobile platforms. ArcGIS also offers developer tools and web services.
The name “ArcGIS” is derived from an earlier platform called “ArcInfo” which was originally designed for vectors. Since every vector feature can be represented by a series of arcs, “Arc” was a simple way to signify the vector focus of the software. (StackExchange)
Capabilities of ArcGIS
Applies location-based analytics to business practices. Get insights using contextual tools to visualize and analyze data. Collaborate and share via maps, dashboards, and reports:
Spatial Analysis & Data Science
Use location to uncover hidden patterns, and improve predictive modeling. Improves decision-making on which sites to visit, look for clusters, make forecasts, and see how patterns develop over time. Creates advanced statistical and machine learning models to maximize the value of your data.
Field Operations
Support field workflows and enable office and field personnel to work in unison, and use the same data. Reduces or even eliminates dependency on paper by using field applications and eliminates mistakes and increases efficiency.
Mapping
Interactive maps help you spot spatial patterns in your data so you can make better decisions and take action. Maps facilitate collaboration. Geocoding transforms addresses to points on a map. Data can be displayed dynamically when it updates with the most up-to-date data which, in turn, improves the quality of decision-making.
3D GIS
Brings real-world context to maps and data, Data can be transformed into smart 3D models and visualizations that can help you analyze and solve problems and share ideas with your team and customers.
Imagery & Remote Sensing
Manage and extract answers from imagery and remotely sensed data sourced via drone, aerial, and satellite imagery. Using mapping, geospatial analytics, geospatial artificial intelligence and modeling tools remotely sensed data can be used for better decision-making regarding local and global challenges.
Data Collection & Management
Easily collect, crowdsource, store, access, and share your data. Integrate data stored in business systems and geo-enable any data from any source. (https://www.esri.com/en-us/arcgis/about-arcgis/overview)
So, ArcGIS software and apps combine mapping and data analytics to deliver location intelligence for commercial enterprises, government, manufacturing, and utilities. There is an alternative to ArcGIS called QGIS which is an open-source desktop GIS. QGIS is an official project of the Open Source Geospatial Foundation (OSGeo). It runs on Linux, Unix, Mac OS X, Windows, and Android and supports numerous vector, raster, and database formats and functionalities. (https://qgis.org/en/site/about/index.html)
How can GIS facilitate better emergency planning?
Now that we know what GIS is, how can it be used to help local governments, emergency responders, and corporations?
With natural disasters on the rise, as well as the potential for other types of man-made calamities becoming evident, GIS can address the need to process immense amounts of information and make sense of it to prevent loss of human life, and damage to property, infrastructure, and businesses.
Author Jacqueline Legrand (Forbes, Dec. 2019) suggests four ways that GIS can help:
Spatial Awareness
GIS technology enables municipal and state governments, support groups, and affected parties to enhance reaction times through spatial awareness (e.g., utility companies, manufacturers, real estate, and retailers). Furthermore, GIS assists in communicating the locations and best routes to emergency evacuation centers, as well as providing essential information on road closures and high-risk areas.
Spatial awareness is also useful in disaster preparation and recovery operations. Visually displaying where specific localities lack emergency response capabilities in comparison to climate risk can help politicians and government organizations understand which areas require the greatest attention before or after a catastrophic occurrence.
Real-Time Monitoring
Weather variations can radically alter emergency response methods and supply chain routes. From wildfires to floods, real-time surveillance of wind speed and direction is critical to the safety of first responders, corporate staff, and community residents.
GIS combines data from various sources and formats, including real-time data. GIS technology evaluates and emphasizes the greatest danger locations when updates from the National Weather Service, on-the-ground responders, and government organizations arrive.
Using this information, emergency management teams can quickly identify and send the nearest units to specified regions, as well as forecast where more resources may be required as the situation progresses.
Integrated Data
GIS frameworks consolidate and organize data from a wide range of agencies, organizations, and institutions. GIS, especially when combined with monitoring equipment such as drones or remote sensing devices, can project how data interacts with one another.
Putting all of this information on a single geospatial map gives a clearer image of all the components that go into good short- and long-term readiness, as well as a quick way to see how different relief efforts could affect other aspects of direct response. It may connect corporate resources, such as building design blueprints, with disaster response teams to optimize rescue operations and reduce damage.
Public Education And Awareness
Using geospatial mapping to show the extent of the devastation can also help with outreach and draw more attention to future relief efforts. Before, during, and after a crisis, a visual representation of what resources are nearby (or not) may express the gravity of a problem to people far more effectively than a collection of data grids.
GIS is a helpful tool for relaying information in a way that the general public can understand and act on ongoing or future warnings or emergency notifications.
GIS Use Cases for Retail Business Automation
Retail Applications
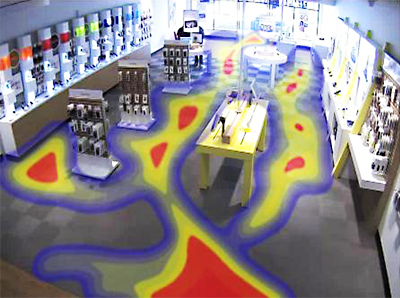
Spatial Awareness:
Companies may use heat maps in a number of ways, depending on the goal of their data analysis. Heat maps may be used to represent productivity, marketing efforts, and nearly any other issue that has to be tracked quantitatively.
For example, businesses are using camera-based technology to track what you touch, what you ignore, and where you move in order to enhance shop layouts. Retailers benefit greatly from knowing where their consumers go. It enables them to optimize shop layout and plan where items should be placed. (Business Insider)
Photo credit: realstoreanaytics.com
Real-time Monitoring:
Companies that employ “secret or mystery shoppers” do so to assess a business and its employees from a customer experience perspective. Mystery shopping is a method for gaining a deeper understanding of a customer's experience. It entails field research conducted by independent auditors posing as clients. Geolocation has become an important tool for employers of mystery shoppers to confirm or verify that the employee is at the correct location. Location is verified through a smartphone app that uses the device's internal GPS to verify location. Not only does this add legitimacy to the mystery shoppers' report but it also mitigates the possibility of human error (not shopping at the correct location) or fraud on the part of the employee.
Photo credit: Vecteezy.com

Integrated Data:
GIS enables a company to see patterns based on geography. With the rise of eCommerce physical “brick and mortar,” stores must develop a better in-store experience. Some of the benefits of GIS mapping for retailers are:
- Finding a site: It's all about the location. It may make all the difference in whether a company succeeds or fails. With data from sources such as customer demand, traffic patterns, and the location of the local population, GIS mapping may aid in the selection of the best location.
- Identify Competition: Retailers may use GIS to see where their competitors are with respect to their own location. GIS may give a visual picture of adjacent competitors, their operating hours, and marketing strategies, allowing for a better knowledge of the industry.
- Analyze Customer Demographics: Retailers will require consumer information such as name, location, zip code, and items purchased to make the most of GIS mapping. Retailers can use GIS mapping to correlate this data to geographic information, which not only provides insights into the data but also allows them to plot profitable consumer groupings and learn more about lifestyle patterns.
- Manage Delivery Routes: GIS can better inform schedule requests, arrival and departure times, customer sites, and many other aspects of supply chain management, making it a useful tool for improving fleet management. With mapping analysis, you can bring complicated data to life and connect the dots for shipping and delivery procedures.
- Targeted Marketing Campaigns: GIS allows retailers to create multidimensional representations of client preferences, dislikes, and purchase patterns. Analyzing market trends is a crucial step in effectively interacting with clients through marketing. Retailers may use spatial analytics to design marketing personas and strategies, experiment with new media, and execute direct mail campaigns. Retailers may access a wealth of data using mapping software, including demographic profiles, local rivals, and more. Retailers can better comprehend data, make better decisions, and communicate by using GIS mapping to visualize information. (Mapline, 2018)
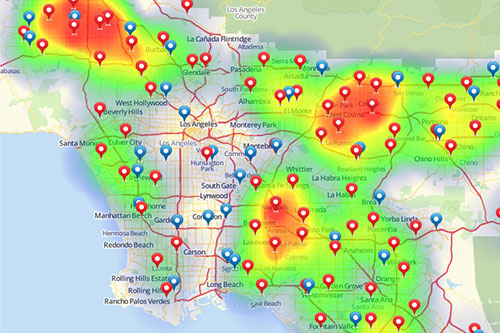
Photo credit: Mapline.com
GIS Use Cases for Emergency Management
The SilverLogic (TSL) developed an emergency app called Levels, that leveraged augmented reality (AR) for iOS that won 2nd prize in the eMerge Americas Hackathon in 2018. The app's focus is to aid disaster preparedness for low-lying coastal areas and includes a missing person locator for use after a natural disaster. The idea behind the AR portion of the solution was simple: By visualizing potential flood levels in real-time, it would help users get a much better sense of what different levels of storm surge could really do to different properties. The app also contained a supply calculator that estimates the number of sandbags needed in order to ward off different levels of flooding based on different elements of the property to be protected. The missing person finder uses an integrated facial recognition tool from Kairos to match a current photo with one that would be stored in a central database. For privacy reasons, Levels does not give the actual location of the individual – but a confirmed check-in via the app would post that person as accounted for and provide peace of mind until more thorough communication channels are restored.
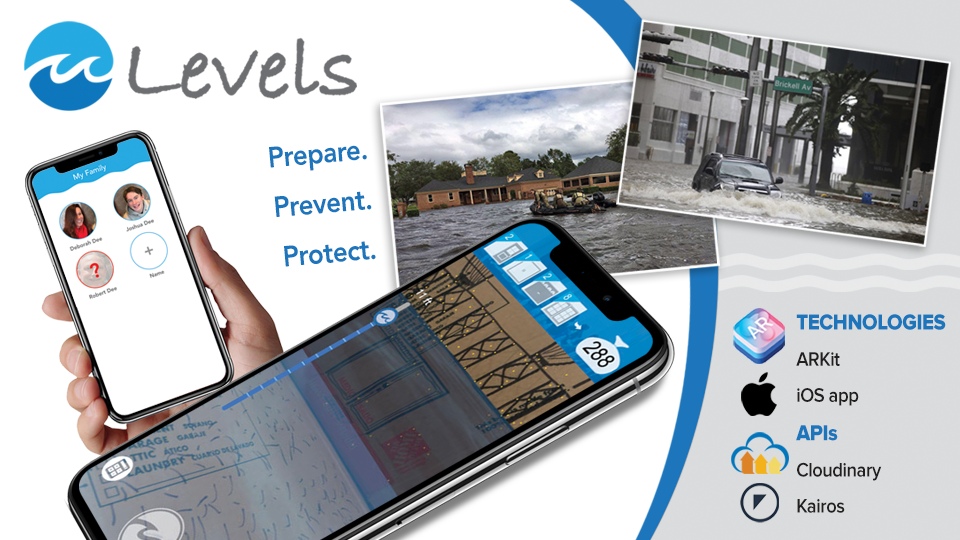
Levels is a working prototype built in under 24 hours, and we did not have the time to integrate any GIS features, but with an app like this the benefits of incorporating GIS technologies are readily apparent and we look forward to working with GIS technologies in the future.
Another TSL project that was known internally as STS, incorporated a GPS panic button with nationwide coverage into an app for the mobile personal protection of customers wherever they are located. Once the virtual “Help” button is tapped on the smartphone display the central station is notified and presented with a map showing the location along with specific emergency responder contact information.
The potential for GIS mapping technology uses for emergency management is endless. The SilverLogic can help you leverage this technology to get your great idea off the ground and into development.
Call us today!